Quick Connect
Put a stop to spreadsheets, instead try customized analytics solutions from Kivo Visual Labs
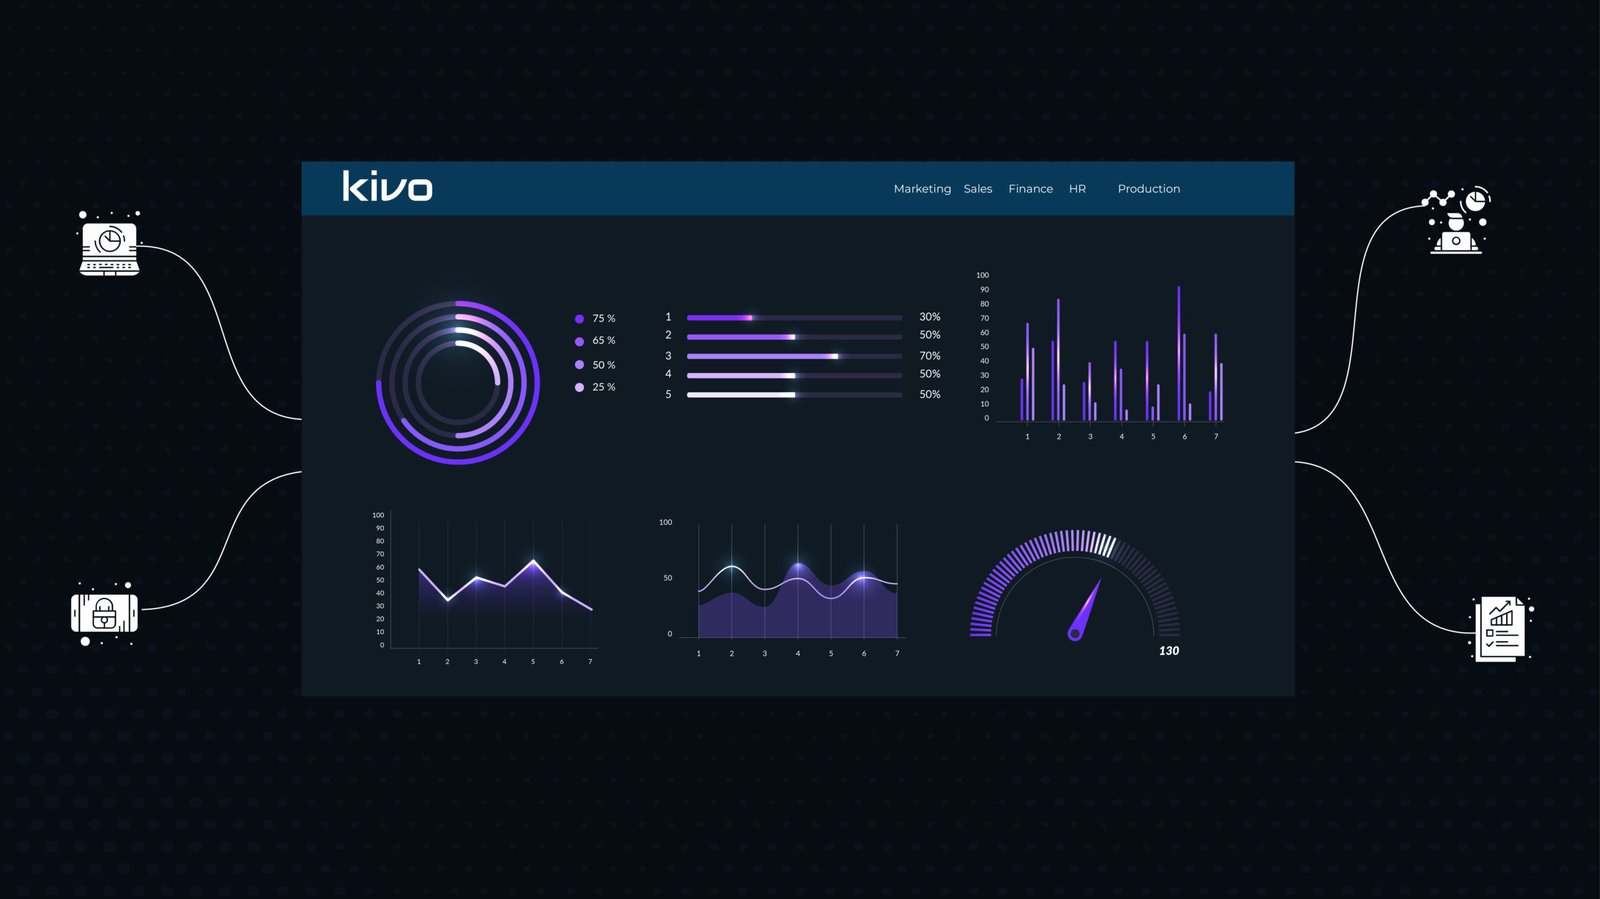
Kivo Visual Labs data visualization services make complex data simple and actionable. Intuitive dashboards, interactive reports, and consulting—custom-built for your business.
Transition from dashboards to decision boards to make data-driven decisions quickly. Go beyond traditional visualization with our data visualization services that enable businesses to understand the “why” behind each pattern or trend. We help global business leaders accelerate time to insights with BI platform development from scratch and BI modernization of their existing systems. Our data visualization consulting services help enterprise leaders refine their strategies, break free from report clutter, and get insights that actually matter to their businesses and goals.
Our analytics platform helps you save time and resources by eliminating the need to build a BI module from scratch.
Stay ahead of the competition with real-time, actionable insights from our cutting-edge embedded BI tool.
As your embedded analytics partner, we ensure fast, efficient deployment so you can deliver customer value immediately.
Data activation unlocks your data’s potential. Modernize, govern, and automate for AI-powered insights.

Facilitate the migration of legacy data assets to modern, cloud-powered systems, ensuring they are ‘AI ready.’
Emphasize robust data governance and quality management practices to ensure data integrity.
Create semantic data catalogs using knowledge graph models that map relationships, describe data in its business context, and integrate disparate data sources.
Leverage AI and automation throughout the data lifecycle to streamline processes and enhance efficiency.
We help you centralize all your data, encompassing structured and unstructured formats from across your organization and beyond. This includes designing and implementing data lakes and warehouses, both on-premises and in cloud environments.
From batch processing to real-time ingestion, we streamline your data flow. We handle the entire journey: collecting, cleaning, preparing, and transforming your data so it’s always ready and available across your organization.
We help you visually analyze vast amounts of data to build impactful reports and dashboards, empowering better business planning and future performance. Dive deeper into your information to discover critical, hidden patterns. Access your insights seamlessly, anywhere, on any device.
From adding a layer of security and governance to distribution through automated emails, embedded dashboards, mobile apps or chatbots, we’ve done it all for our clients.
Your BI solution is useful only when your business embraces it. Run specialized adoption programs built to kickstart and sustain the use of analytics within your organization. Ensure optimum performance with our support and maintenance services.
We offer end-to-end support for Power BI and data analytics. Our services cover everything from initial setup and data integration to advanced dashboard and data model development. We ensure data quality through cleaning, transformation, and preparation. Beyond that, we provide performance tuning, troubleshooting, and ongoing maintenance. Whether it’s custom reports, complex DAX formulas, or self-service analytics training, our aim is to help clients use their data strategically for better business decisions and tangible results.
Gain a competitive edge by making data-driven decisions that improve product quality, accelerate time-to-market, and enhance customer satisfaction.
Identify and eliminate bottlenecks in production processes, optimize resource utilization, and reduce downtime.
Empower employees with real-time data and insights to improve their performance and efficiency.
Gain a competitive edge by making data-driven decisions that improve product quality, accelerate time-to-market, and enhance customer satisfaction.
Optimize inventory levels, minimize waste, and improve overall operational costs.
We’ve migrated and modernized large data systems for numerous large enterprises – the wealth of insights and industrial awareness gained during this journey enables us to provide highly optimized data modernization services to our customers.
We enable organizations to leverage modern data technologies while helping them continuously scale with a strong emphasis on technical debt reduction.

\ Business Objective Requirements: Report objectives, Audience and upstream/downstream activities related to reports
\ Technical Constraints: Organization preferences on tools and technologies. Application type – Desktop/ Web /Mobile
\ User Needs: Stakeholder expectations, analysis outcomes and access control
Kivo Visual Labs LLP
Sign up for our newsletter to discover winning trends before your competition!